Meshes
While medical imaging always starts with 3D bitmaps where each voxel has a specific intensity, vertex-based meshes are often derived from this data. NiiVue can simultaneously show voxels and meshes. It can view three different classes of meshes: triangulated meshes, connectomes and streamlines. All four of these representations are shown in this interactive image. First, it shows a grayscale voxel-based image. Second, the green cortical surface is a triangulated mesh, with a statistical overlay shown in yellow. Third is the ball and stick connectome. Finally, a blue streamline tract is visible. Note that the size of the volumes and triangulated meshes are fixed, In contrast, the size of connectomes and streamlines are dynamic, and we can scale the radius of these objects.
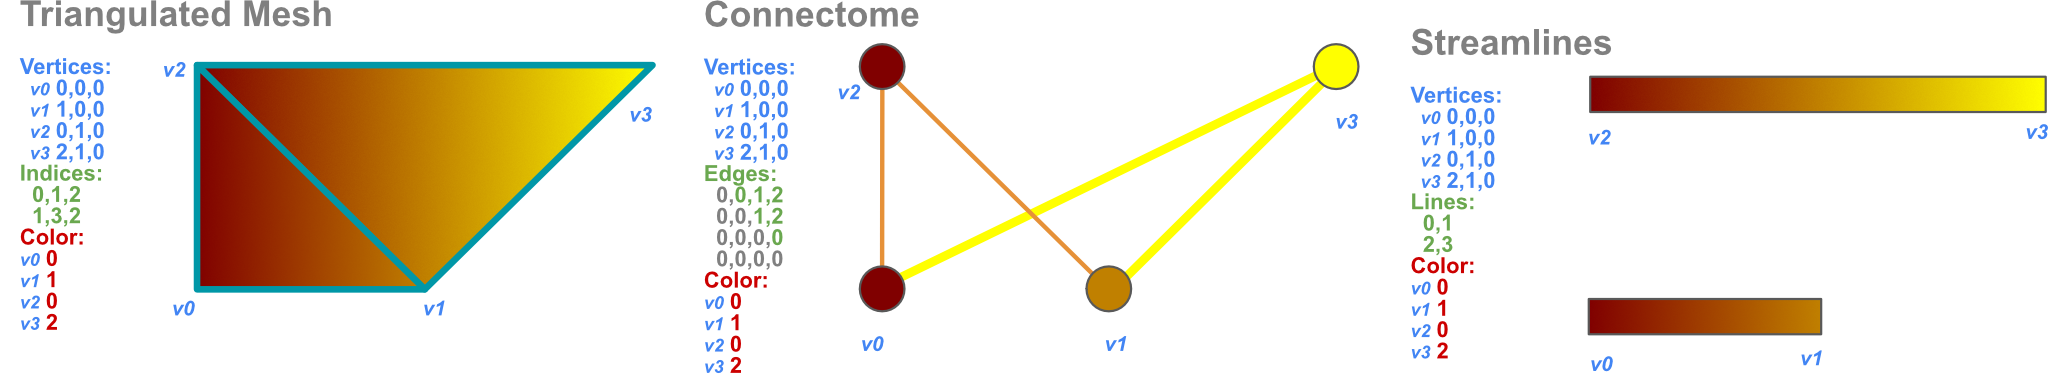
These three classes are illustrated in the figure below:
Triangulated Meshes
- Triangulated meshes are based on vertex locations as well as indices that group the vertices into discrete triangles. Vertices are often reused by multiple triangles: in the figure above
v1andv2are each used by two triangles. - NiiVue never adjusts the position of triangulated mesh vertices.
- The winding order of the indices discriminates the front from the back face. Therefore, the front face of the triangle
0,1,2is the back face for0,2,1. NiiVue assumes a counter clockwise winding order. - Triangulated mesh color can be influenced by overlays, which specify the scalar intensity (e.g. statistical map) or red/green/blue color of each vertex. The NiiVue mesh atlas live demo allows the user to interactively adjust the transparency of two overlays on a single mesh: an atlas as well as a statistical map.
- Supported mesh-based formats: GIfTI, ASC, BYU/GEO/G, BrainSuite DFS, ICO/TRI, PLY, BrainNet NV, BrainVoyager SRF, FreeSurfer, MZ3, OFF, Wavefront OBJ, STL, Legacy VTK, X3D.
- Supported mesh overlay formats: GIfTI, CIfTI-2, MZ3, SMP, STC, FreeSurfer (CURV/ANNOT).
Connectomes
- Connectomes are ball and stick figures that represent nodes (spheres) and the edges (cylinders) that connect them.
- NiiVue extrudes the node location and edge weights to triangulated spheres and cylinders - the diameter of these structures can interactively adjusted. The sliders for the connectome live demo demonstrates how NiiVue will dynamically scale these features.
- The color and size of connectome nodes and edges can be based on scalar values, for example statistical test scores. In the image above, the edge color is determined by edge strength, and node color by overlay color. Note the edge strength is shown as a matrix that maps the link weight between each node and all others using the upper triangle.
- The pointset live demo shows how connectome features can be added and removed.
- NiiVue uses a simple JSON format to represent connectomes.
Streamlines
- Streamlines are used for tractography data.
- Streamlines can either be drawn as single-pixel lines, or extruded to triangulated cylinders. The
radiusslider of the tract live demo shows how NiiVue dynamically scales the diameter. - Each vertex of a streamline can be assigned a color based on the global direction, local direction, group, per-vertex or per-streamline properties. The tract group live demo showcases these properties.
- The TrackVis TRK format is popular. However, it uses voxel corner to specify coordinates, rather that the typical voxel center or world space coordinates. While nibabel, Surfice and NiiVue follow this convention, be aware that other tools (included DSI Studio) use voxel centers. This means that TRK files created by one tool can appear shifted by half a voxel in other tools. A validation dataset is available.
- Supported streamline-based formats: TCK, TRK, TRX, TT, VTK, AFNI .niml.tract
- Overlay properties are commonly embedded inside TRX and TRK format streamlines, but can also be loaded from separate TSF files.